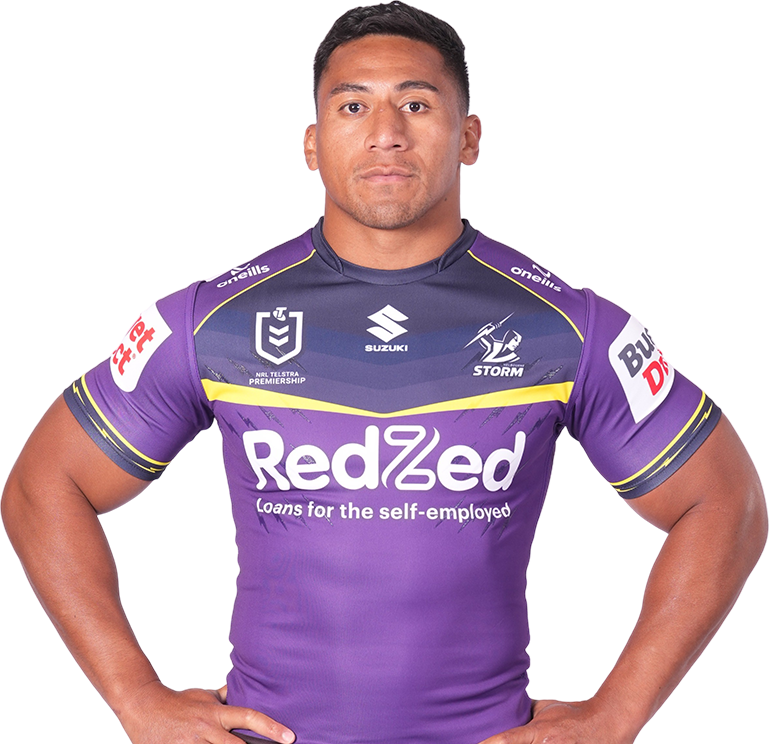
Marion Seve
Centre
Player Bio
- Height:
- 180 cm
- Date of Birth:
- 27 May 1995
- Weight:
- 92 kg
- Birthplace:
- Ipswich, QLD
- Age:
- 31
- Nickname:
- Maz
- Debut Club:
- Melbourne Storm
- Date:
- 22 March 2019
- Opposition:
- Canberra Raiders
- Round:
- 2
- Biography:
Now one of the longest serving members of Storm’s Top 30 squad, Seve has time and time again shown himself as the ultimate clubman.
Known for his resilience and toughness, the outside back has endured a luckless run of injuries since making his debut in 2019 but none more so than the past two seasons.
Seve, a Samoan international provides critical versatility with the ability to cover both wing and centre..
Marion is sponsored by DMS Carpets.
Career
- Appearances
- 51
- Tries
- 13
Career By Season
| Year | Played | Won | Lost | Drawn | Win % | Tries | Goals | 1 Point Field Goals | 2 Point Field Goals | Points | Kicking Metres | Kicking Metres Average | Goal Conversion Rate | Try Assists | Linebreaks | Receipts | Tackles Made | Missed Tackles | Tackle Efficiency | Total Running Metres | Average Running Metres | Kick Return Metres | Total Points | Average Points | |
|---|---|---|---|---|---|---|---|---|---|---|---|---|---|---|---|---|---|---|---|---|---|---|---|---|---|
| Storm | 2019 | 12 | 11 | 1 | - | 92% | 4 | - | - | - | 16 | 25 | 2.08 | - | 2 | 6 | 143 | 153 | 13 | 92.17% | 1,167 | 97.00 | 34 | 347 | 28.9 |
| Storm | 2020 | 7 | 5 | 2 | - | 71% | - | - | - | - | - | 4 | 0.54 | - | - | 3 | 67 | 57 | 6 | 90.48% | 583 | 83.00 | 40 | 126 | 18.0 |
| Storm | 2021 | 2 | 2 | - | - | 100% | 2 | - | - | - | 8 | - | - | - | - | 1 | 28 | 35 | 4 | 89.74% | 209 | 104.00 | - | 104 | 52.0 |
| Storm | 2022 | 15 | 6 | 9 | - | 40% | 3 | - | - | - | 12 | 11 | 0.73 | - | 2 | 6 | 183 | 306 | 27 | 91.89% | 1,710 | 114.00 | 31 | 591 | 39.4 |
| Storm | 2023 | 10 | 7 | 3 | - | 70% | 3 | - | - | - | 12 | - | - | - | 2 | 5 | 134 | 153 | 14 | 91.62% | 1,272 | 127.00 | 11 | 372 | 37.2 |
| Storm | 2024 | 1 | - | 1 | - | - | - | - | - | - | - | - | - | - | - | - | 5 | 1 | - | 100.00% | 53 | 53.00 | - | 4 | 4.0 |
| Storm | 2025 | 4 | 2 | 2 | - | 50% | 1 | - | - | - | 4 | - | - | - | - | 1 | 35 | 41 | 6 | 87.23% | 289 | 72.00 | - | 80 | 20.0 |
Career Overall
| Year Start | Year End | Played | Won | Lost | Drawn | Win % | Tries | Goals | 1 Point Field Goals | 2 Point Field Goals | Points | Kicking Metres | Kicking Metres Average | Goal Conversion Rate | Try Assists | Linebreaks | Receipts | Tackles Made | Missed Tackles | Tackle Efficiency | Total Running Metres | Average Running Metres | Kick Return Metres | Total Points | Average Points | |
|---|---|---|---|---|---|---|---|---|---|---|---|---|---|---|---|---|---|---|---|---|---|---|---|---|---|---|
| Storm | 2019 | 2025 | 51 | 33 | 18 | - | 65% | 13 | - | - | - | 52 | 40 | 0.75 | - | 6 | 22 | 595 | 746 | 70 | 91.42% | 5,286 | 99.00 | 118 | 1,624 | 31.8 |
Latest


Team Mates


Melbourne Storm respect and honour the Traditional Custodians of the land and pay our respects to their Elders past, present and future. We acknowledge the stories, traditions and living cultures of Aboriginal and Torres Strait Islander peoples on the lands we meet, gather and play on.