
Harry Grant
Captain - Hooker
Player Bio
- Height:
- 177 cm
- Date of Birth:
- 17 February 1998
- Weight:
- 87 kg
- Birthplace:
- Rockhampton, QLD
- Age:
- 26
- Nickname:
- H
- Debut Club:
- Melbourne Storm
- Date:
- 19 May 2018
- Opposition:
- Manly-Warringah Sea Eagles
- Round:
- 11
- Previous Club:
- Wests Tigers
- Junior Club:
- Yeppoon Seagulls
- Biography:
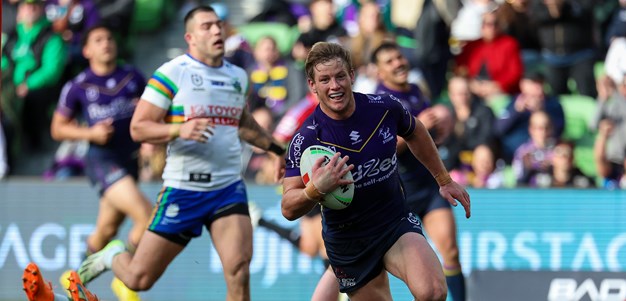
Coming through Storm’s junior pathways, Grant made his NRL debut with Storm in 2018 before getting the unique opportunity to play a season on loan at the Wests Tigers in 2020.
Returning to the club at the conclusion of the 2020 season, Grant went on to earn the title of Melbourne Storm’s Best Forward of the Year.
Grant topped the tackle count across the competition in 2023, making 1065 tackles at a 91% tackle efficiency.
The Yeppoon Seagulls junior was also dangerous with ball in hand, managing 12 try assists as he went on to claim Dally M Hooker of the Year.
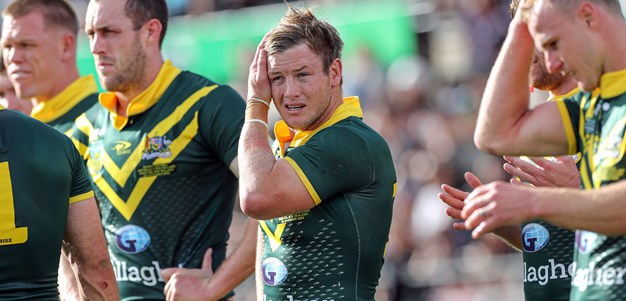
Grant once again played a prominent role for both state and country, pulling on the QLD Maroons and Australian Kangaroos jumper.
One of the best surfers in the club, Harry enjoys heading down to the Bellarine Peninsula or Melbourne’s wave pool on his time off.
Grant was announced as club captain ahead of the 2024 season.
Harry is sponsored by Graham & Kay Middleton, Euphoria Infusions, Victorian Independent Flooring and Spartan Remedial Services.
Harry is sponsored by Victorian Independent Flooring, Euphoria Infusions, Graham & Kay Middleton and Spartan Remedial Services
Career
- Appearances
- 93
- Tries
- 28
2024 Season
- Appearances
- 15
Scoring
- Tries
- 4
Kicking
- Forced Drop Outs
- 3
- Average Kicking Metres
- 44.8
Attack
- Try Assists
- 4
- Line Break Assists
- 4
Passing
- Offloads
- 10
- Receipts
- 1681
Defence
- Tackles Made
- 614
- Tackle Efficiency
-
Running Metres
- Average Running Metres
- 63
- Total Running Metres
- 945
Fantasy
- Total Points
- 756
- Average Points
- 50.4
2024 Season - By Round
| Round | Opponent | Score | Position | Minutes Played | Tries | Goals | 1 Point Field Goals | 2 Point Field Goals | Points | Kicking Metres | Forced Drop Outs | Try Assists | Linebreaks | Tackle Breaks | Post Contact Metres | Offloads | Receipts | Tackles Made | Missed Tackles | Total Running Metres | Hit Up Running Metres | Kick Return Metres | |
|---|---|---|---|---|---|---|---|---|---|---|---|---|---|---|---|---|---|---|---|---|---|---|---|
| 1 | Panthers | Won | 8 - 0 | Hooker | 71 | - | - | - | - | - | - | - | - | - | 3 | 28 | - | 111 | 43 | 4 | 59 | - | - |
| 2 | Warriors | Won | 30 - 26 | Hooker | 80 | - | - | - | - | - | 98 | 1 | - | 1 | 2 | 22 | - | 106 | 39 | 3 | 97 | 15 | - |
| 3 | Knights | Lost | 14 - 12 | Hooker | 80 | - | - | - | - | - | - | - | - | - | 2 | 9 | - | 121 | 57 | 6 | 74 | 9 | - |
| 5 | Broncos | Won | 34 - 32 | Hooker | 80 | - | - | - | - | - | 22 | 1 | - | - | 3 | 22 | - | 117 | 47 | 2 | 78 | - | - |
| 6 | Bulldogs | Won | 16 - 14 | Hooker | 80 | - | - | - | - | - | 1 | - | - | - | 2 | 19 | - | 124 | 54 | 2 | 51 | 14 | - |
| 7 | Roosters | Won | 12 - 18 | Hooker | 80 | - | - | - | - | - | 8 | - | - | - | 1 | 21 | - | 122 | 46 | 6 | 66 | - | 2 |
| 8 | Rabbitohs | Won | 54 - 20 | Hooker | 75 | 1 | - | - | - | 4 | 28 | - | 1 | 1 | 3 | 22 | 1 | 98 | 30 | 4 | 71 | 5 | - |
| 9 | Titans | Won | 20 - 22 | Hooker | 80 | - | - | - | - | - | 128 | - | - | - | - | 13 | 3 | 117 | 39 | 4 | 54 | - | - |
| 10 | Sharks | Lost | 18 - 25 | Hooker | 70 | - | - | - | - | - | 118 | - | - | - | - | 16 | 2 | 116 | 43 | 7 | 48 | 3 | - |
| 11 | Eels | Won | 48 - 16 | Hooker | 67 | 2 | - | - | - | 8 | 45 | - | 1 | 1 | 4 | 15 | 1 | 104 | 30 | 4 | 92 | 26 | - |
| 12 | Sea Eagles | Lost | 26 - 20 | Hooker | 80 | - | - | - | - | - | - | - | - | 1 | - | 1 | - | 117 | 48 | 4 | 61 | - | - |
| 14 | Knights | Won | 36 - 28 | Interchange | 58 | - | - | - | - | - | 144 | 1 | 1 | - | - | - | - | 95 | 31 | 2 | 13 | - | - |
| 15 | Warriors | Won | 24 - 38 | Hooker | 80 | - | - | - | - | - | 35 | - | 1 | - | 1 | 8 | 1 | 110 | 36 | 4 | 31 | - | - |
| 20 | Roosters | Won | 24 - 8 | Hooker | 80 | - | - | - | - | - | 2 | - | - | 1 | 2 | 12 | 1 | 125 | 34 | 5 | 75 | - | - |
| 21 | Eels | Won | 14 - 32 | Hooker | 74 | 1 | - | - | - | 4 | 43 | - | - | - | - | 15 | 1 | 98 | 37 | 2 | 68 | - | - |
Career By Season
| Year | Played | Won | Lost | Drawn | Win % | Tries | Goals | 1 Point Field Goals | 2 Point Field Goals | Points | Kicking Metres | Kicking Metres Average | Goal Conversion Rate | Forced Drop Outs | Try Assists | Offloads | Receipts | Tackles Made | Missed Tackles | Tackle Efficiency | Total Running Metres | Average Running Metres | Kick Return Metres | Total Points | Average Points | |
|---|---|---|---|---|---|---|---|---|---|---|---|---|---|---|---|---|---|---|---|---|---|---|---|---|---|---|
| Storm | 2018 | 1 | - | 1 | - | - | - | - | - | - | - | - | - | - | - | - | - | 17 | 11 | 1 | 91.67% | 2 | 2.00 | - | 9 | 9.0 |
| Storm | 2019 | 1 | 1 | - | - | 100% | - | - | - | - | - | - | - | - | - | - | - | 8 | 6 | - | 100.00% | 3 | 3.00 | - | 6 | 6.0 |
| Wests Tigers | 2020 | 15 | 5 | 10 | - | 33% | 3 | - | - | - | 12 | 283 | 18.89 | - | 2 | 5 | 11 | 1,555 | 746 | 45 | 94.31% | 1,235 | 82.00 | 31 | 921 | 61.4 |
| Storm | 2021 | 15 | 13 | 2 | - | 87% | 5 | - | - | - | 20 | 388 | 25.89 | - | 1 | 9 | 7 | 1,286 | 468 | 35 | 93.04% | 1,428 | 95.00 | 3 | 796 | 53.1 |
| Storm | 2022 | 21 | 13 | 8 | - | 62% | 7 | - | - | - | 28 | 1,461 | 69.59 | - | 8 | 17 | 14 | 2,200 | 846 | 76 | 91.76% | 1,958 | 93.00 | 14 | 1,259 | 60.0 |
| Storm | 2023 | 25 | 15 | 10 | - | 60% | 9 | - | - | - | 36 | 1,350 | 53.99 | - | 7 | 12 | 18 | 2,712 | 1,065 | 107 | 90.87% | 1,755 | 70.00 | 11 | 1,376 | 55.0 |
| Storm | 2024 | 15 | 12 | 3 | - | 80% | 4 | - | - | - | 16 | 672 | 44.78 | - | 3 | 4 | 10 | 1,681 | 614 | 59 | 91.23% | 945 | 63.00 | 2 | 756 | 50.4 |
Career Overall
| Year Start | Year End | Played | Won | Lost | Drawn | Win % | Tries | Goals | 1 Point Field Goals | 2 Point Field Goals | Points | Kicking Metres | Kicking Metres Average | Goal Conversion Rate | Forced Drop Outs | Try Assists | Offloads | Receipts | Tackles Made | Missed Tackles | Tackle Efficiency | Total Running Metres | Average Running Metres | Kick Return Metres | Total Points | Average Points | |
|---|---|---|---|---|---|---|---|---|---|---|---|---|---|---|---|---|---|---|---|---|---|---|---|---|---|---|---|
| Storm |
2018
2021 |
2019
2024 |
78 | 54 | 24 | - | 69% | 25 | - | - | - | 100 | 3,871 | 49.63 | - | 19 | 42 | 49 | 7,904 | 3,010 | 278 | 91.55% | 6,093 | 78.00 | 32 | 4,202 | 53.9 |
| Wests Tigers | 2020 | 2020 | 15 | 5 | 10 | - | 33% | 3 | - | - | - | 12 | 283 | 18.89 | - | 2 | 5 | 11 | 1,555 | 746 | 45 | 94.31% | 1,235 | 82.00 | 31 | 921 | 61.4 |
Latest
Team Mates

Melbourne Storm respect and honour the Traditional Custodians of the land and pay our respects to their Elders past, present and future. We acknowledge the stories, traditions and living cultures of Aboriginal and Torres Strait Islander peoples on the lands we meet, gather and play on.

